David McCandless, data journalist and information designer presented beautiful interactive 2D maps and infographs of data, showing how beautiful data representations can be a "relief" in all the information overload. His designs are as beautiful as informative, giving data meaning and putting it into interesting context.
David McCandless at TED Talk August 2010
Considering this knowledge, when you think of the next step of how to design new ways for presenting and interacting with big data, the third dimension and audio sonification might be the next evovlement for big data solutions.
Three dimensional ways of visualization scientific data is nothing completely new though, as are for instance the 3D visuals of particle accelerator results, just recently becoming more famous due to the discovery of the Higgis Bossom.
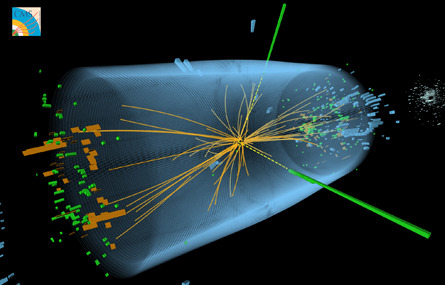
In that case though, the visuals refer more to the actual movement of particles, than translating or interpreting numerical data in a more understanding and meaningful way. Still, it is a beautiful and stunning visualization style that could also be used for many different applications.
Some big data solution providers, such as TerraEchos, FMS and Mindtel are already using state of the art 3D technology for big data visulizations. Achieved with the augemnted reality tool zSpace, data becomes a immersive, interactive and physically touchable. "While 3D capabilities are still advancing — the potential to use these types of technologies as a way to discover valuable organizational trends is certainly within reach." - Dave Chavez, 11.09.12, WIRED Magazine
ZSpace promotional Video
References
Sadowa.tumblr.com (2012) The Reviewer Library (A computer visualization depicts one array of...). [online] Available at: http://sadowa.tumblr.com/post/26485355751/a-computer-visualization-depicts-one-array-of [Accessed: 14 Nov 2012].Ted.com (2010) David McCandless: The beauty of data visualization | Video on TED.com. [online] Available at: http://www.ted.com/talks/david_mccandless_the_beauty_of_data_visualization.html [Accessed: 29 Nov 2012].
Wired.com (2012) Is 3D Visualization the Next Step For Big Data? | Innovation Insights | Wired.com. [online] Available at: http://www.wired.com/insights/2012/11/3d-visualization-big-data/ [Accessed: 14 Nov 2012].
Zspace.com (2012) zSpace - revolutionary virtual-holographic computing. [online] Available at: http://zspace.com/ [Accessed: 14 Nov 2012].
No comments:
Post a Comment